Adding logs to your Grafana dashboard 
In this guide, you will learn how to add logs to your Grafana dashboards. Logs are a valuable source of information for debugging and monitoring your applications. By adding logs to your Grafana dashboards, you can correlate logs with metrics and traces to get a complete picture of your application's health.
Prerequisites 
- A Grafana dashboard
Add logs to your dashboard 
To add logs to your Grafana dashboard, you need to open the dashboard in edit mode and add a new Visualization to the dashboard. This will open the Visualization editor where you can configure the log query and display options.
- Open your Grafana dashboard in edit mode.
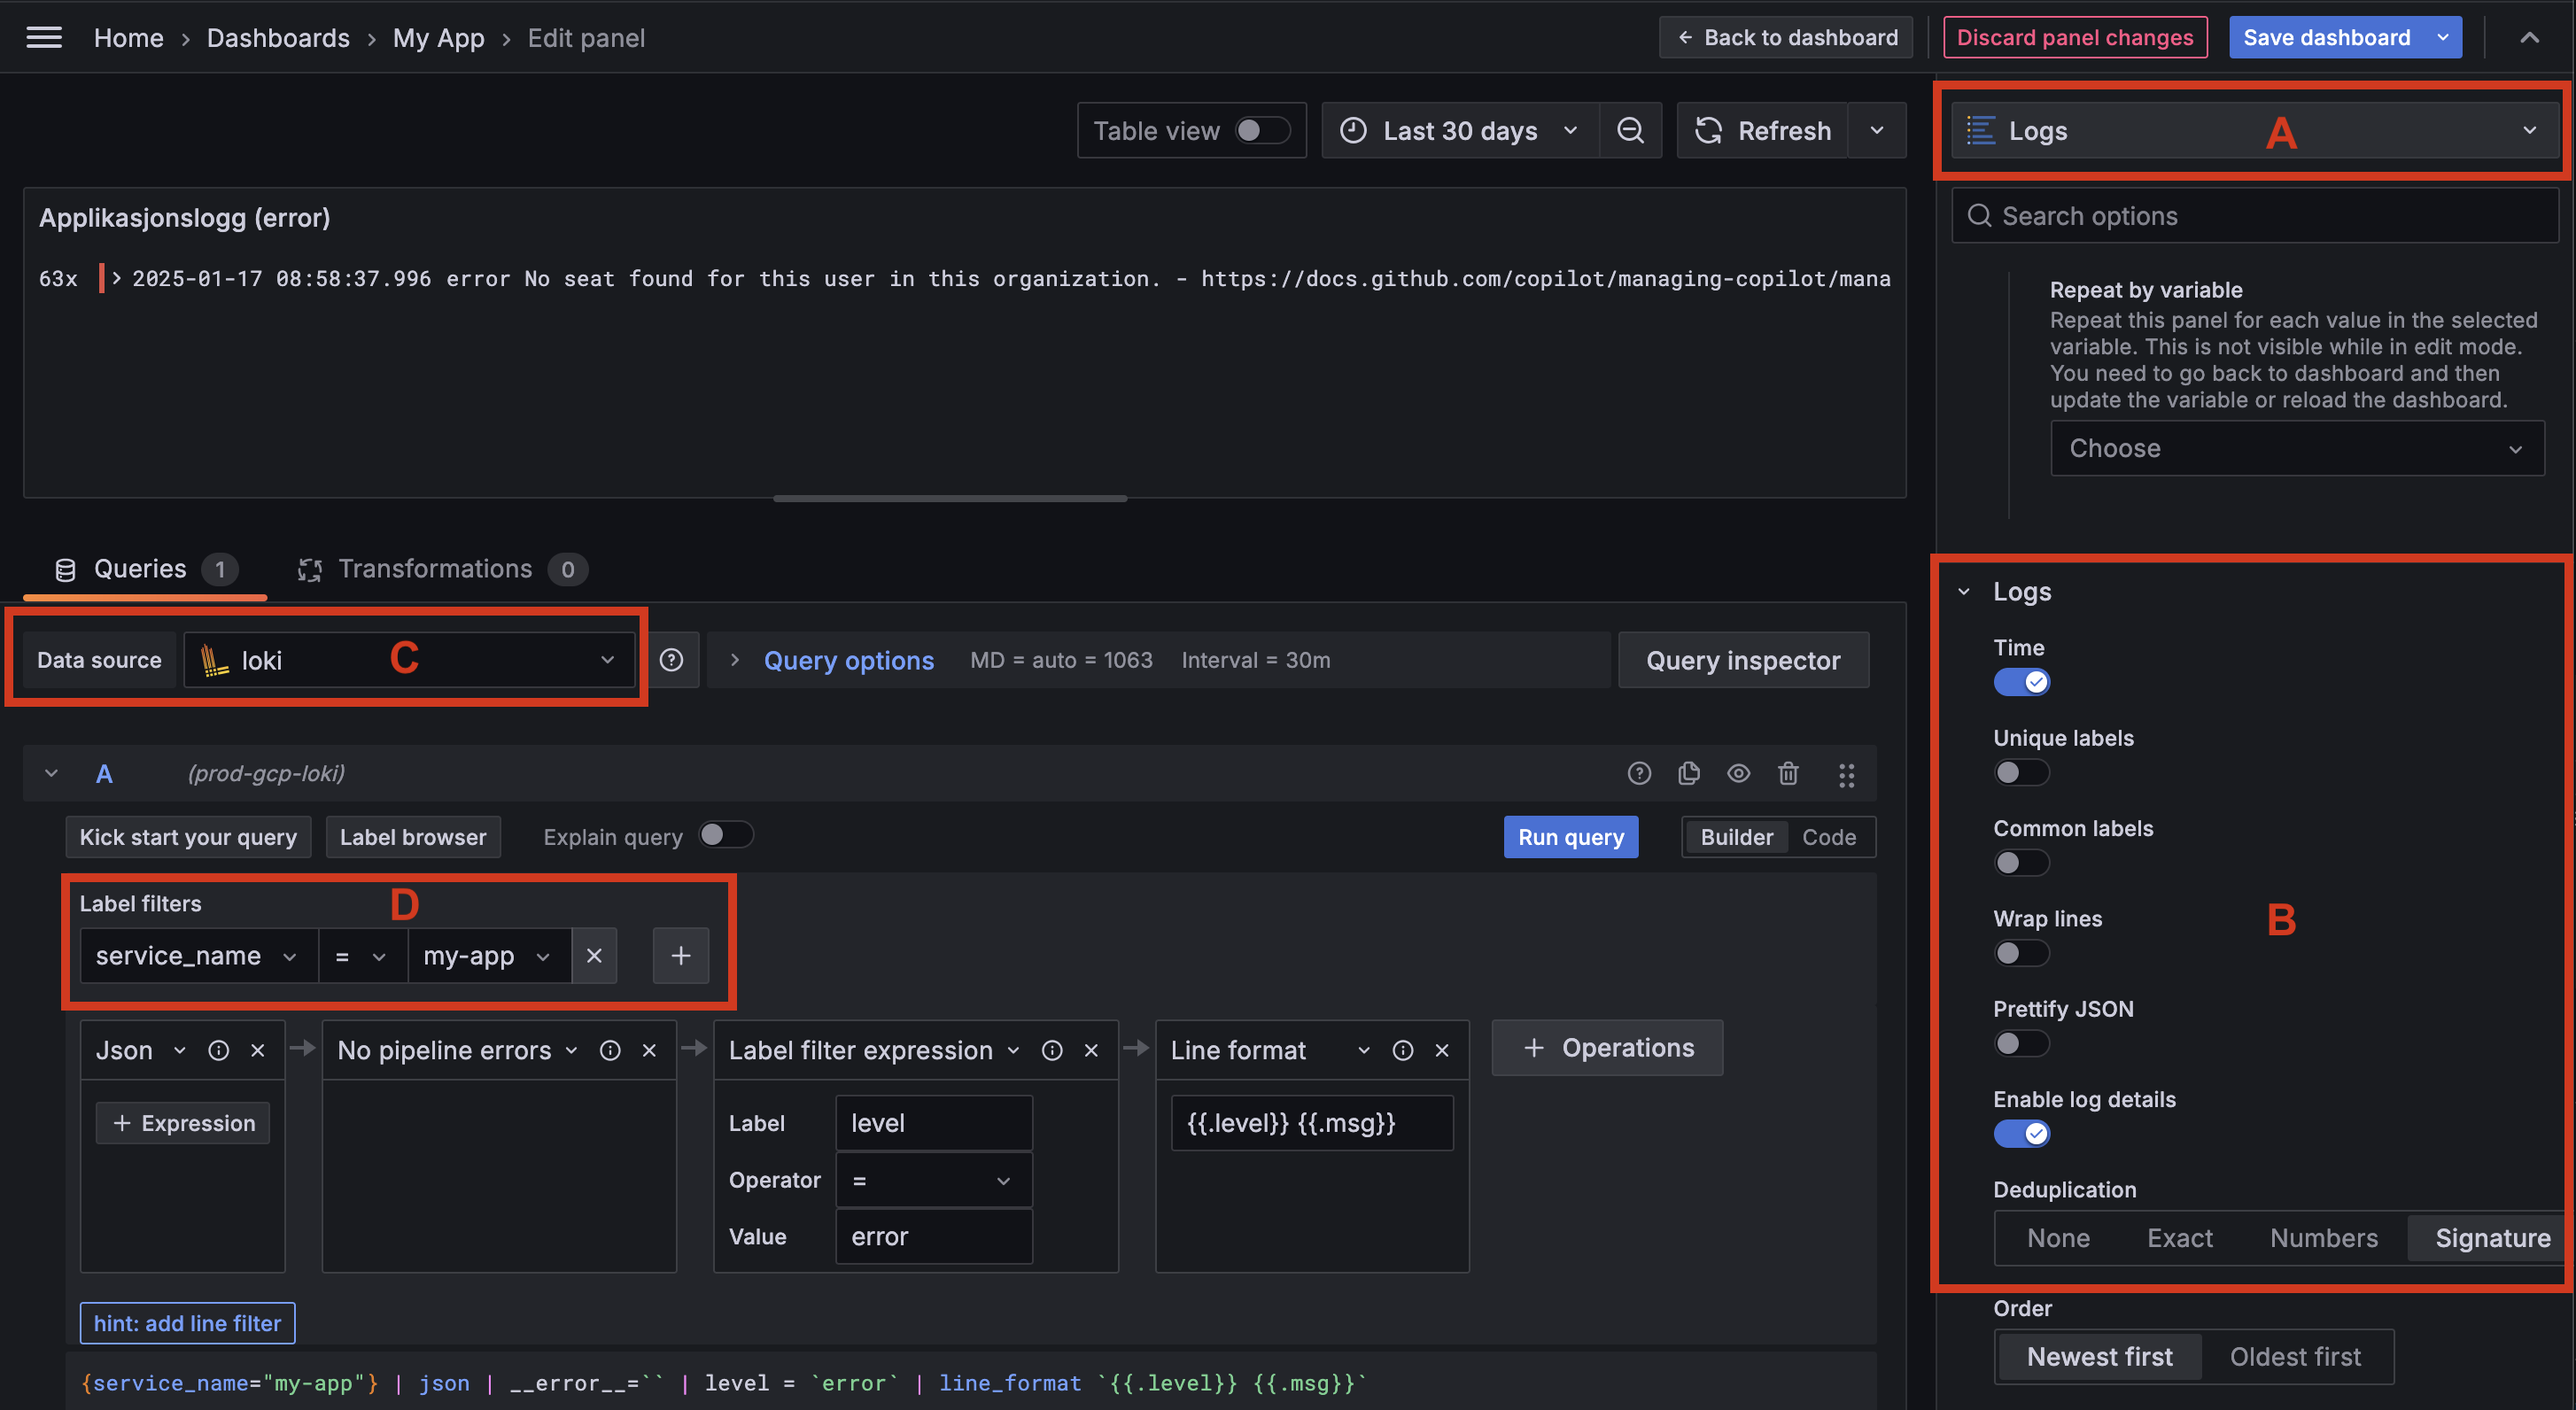
- Click the
Addbutton in the top menu and selectVisualization. - Select
Logsas the panel visualization type (A) - Optionally, you can configure log display and de-duplication (
B). - Select the Loki data source (
C). - Enter your LogQL query in the query editor (
D). Here you can filter logs by indexed labels such asservice_name, andservice_namespace. - Add additional query operations such as Json parsing, filtering, and aggregation (
E).
In the above example, we are querying logs from the service_name label with the value my-app. We then parse the JSON log message (ignoring any parsing errors) and filter logs with the level field set to error. Lastly we format the log line as level and message ({{ .level }} {{ .msg }}).